November 13th, 2008[ANN] Synthesis 0.2.1 with Visualizations and Rails Tip
The new version of Synthesis 0.2.1 was just released and the great news is that my experimental work with visualizations was integrated into the master branch! Just sudo gem update synthesis to grab the latest version.
Why Visualizations?
“…reducing the volume and increasing the value of test code by connecting the dots.”
As George pointed out in his first post about Synthesis, it helps you to connect the dots of your tests, to increase your confidence in the system. I like to think of it as a mock coverage tool. When you use a mock in your test, you’re explicitly stating what interaction you expect to happen. How do you really know that the actual object will behave as you expect? You probably need a unit test around it to guarantee it does what it should. Synthesis helps you connect those dots, breaking your build when a mocked expectation is not met in the “real world”.
By using it in a real project, I noticed that the textual output was getting quite verbose. While coding, I was usually only interested in the failure expectations, but when I stopped to look at the whole output, I noticed there were a lot of interesting information hidden in there. If only I could have a better representation of that information…. that’s exactly what software visualization is all about! I had to dig into Synthesis internals to understand how to hook a different report formatter, but the end result ended up being quite good:

Generating Visualizations
To generate such a visualization, first make sure you have sexp_processor installed (sudo gem install sexp_processor) you need to configure your Synthesis rake task to use the dot formatter:
Synthesis::Task.new do |t| t.adapter = :rspec t.pattern = 'spec/**/*_spec.rb' t.formatter = :dot t.formatter_out = 'synthesis.dot'end |
This will create a synthesis.dot file that can be used to generate a Graphviz image. You can download and install Graphviz for your prefered platform (there’s even a Mac OS X version), but all you need is the command line dot tool to generate your visualization. Just execute:
dot -Tpng -o synthesis.png synthesis.dot |
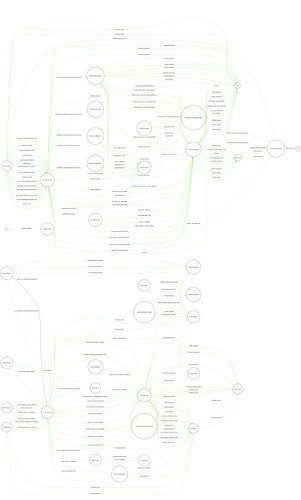
This will create a synthesis.png image file that will show your tested expectations in green, and untested expectations in red. You can generate other output files by changing the -T option (try ps, pdf for a higher quality). There are still a lot of things to improve in the formatter and any feedback is welcome, but it proved to show some interesting information in my last project, as you can depict in the following picture (notice that the app is mainly composed of 2 subsystems that don’t share dependencies):
Tip: Running Synthesis with Rails
Recently, when trying to use Synthesis in a Rails project, I had some problems that took me a while to figure out. As always, the solution was quite small, so I thought it would be nice to share it with everyone. To run Synthesis on a Rails project, make sure you add the following lines to your Synthesis rake task:
Synthesis::Task.new do |t| RAILS_ENV = "test" Rake::Task['environment'].invoke # This may make your build slower. Use only if needed t.pattern = 'test/**/*_test.rb' end |
Give Synthesis a try in your project and let us know how it goes. You might be disappointed in the beginning about how many expectations you’re not testing, but even if not all of them really require a test, it is still a very valuable information to have. Let me know if you have any issues with the dot formatter as well, as I’m sure there are a lot of kinks to be sorted out. Feedback is always welcome!
![]()


 Twitter
 LinkedIn
 Facebook
 Flickr
